There are no items in your cart
Add More
Add More
| Item Details | Price | ||
|---|---|---|---|

This blog post is the first in a three-part series about technical analysis triangle chart patterns. The series views these patterns as glimpses of market psychology moments when price action pauses trending and begins to negotiate rather than as simple shapes on a chart.
In this first part, we focus on the symmetrical triangle, the most neutral and often misunderstood of the three continuation patterns.
A Market That Signals Uncertainty
Generally speaking, markets are expressive. When conviction (bullish emotion) is strong, they trend higher; when fear (bearish sentiment) takes over, they fall rapidly. However, there are times when neither side is self-assured enough to exert significant pressure. Volatility stops, prices begin to move within a smaller range, and involvement decreases.
This is the emergence of symmetrical triangles.
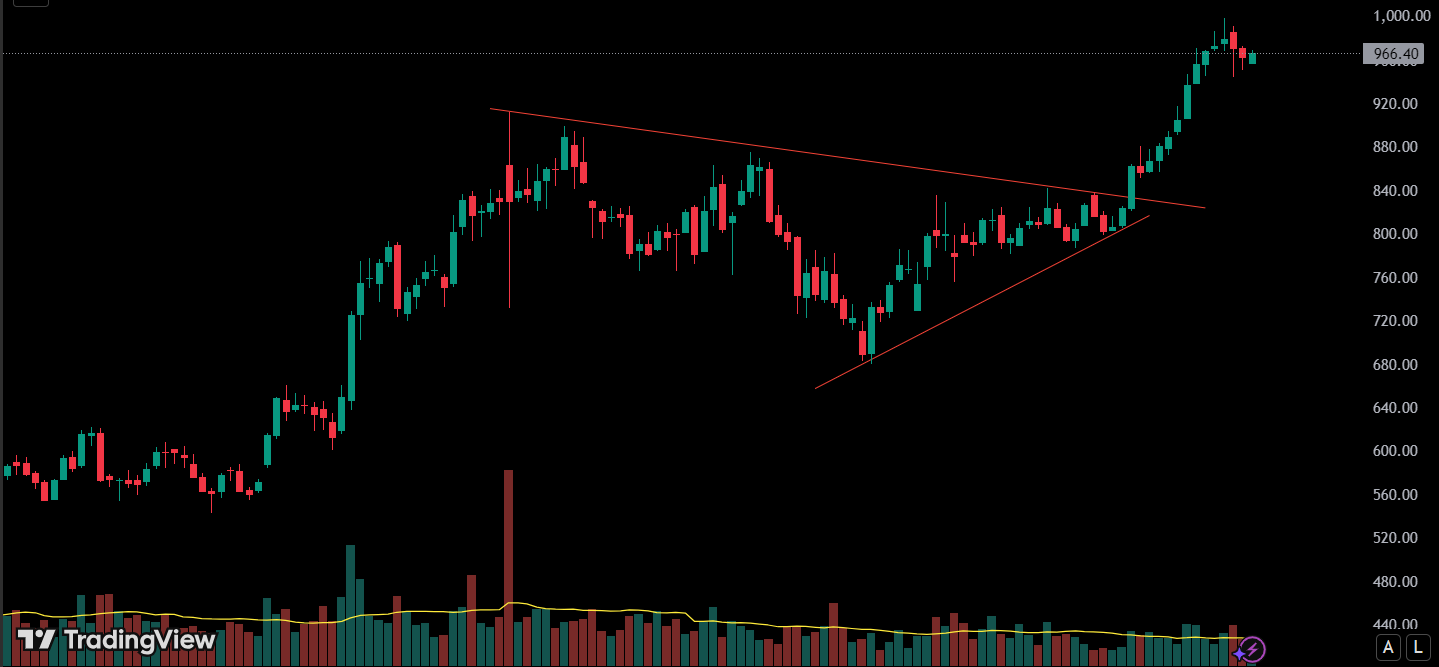
When prices reach lower highs and higher lows, they gradually compress into a narrow range that is defined by two converging trendlines, forming a symmetrical triangle. The bottom trendline slopes upward, whereas the top trendline slopes downward. Neither buyers nor sellers appear to be in control. Rather, the chart pattern indicates a consolidation pattern by reflecting uncertainty
What Actually Takes Place Underneath the Pattern
This pattern symbolizes a transient equilibrium of uncertainty on a psychological level.
The willingness of sellers to sell aggressively at lower prices (higher lows) has decreased. In the absence of new information, buyers are unwilling to push for price increases (lower highs). Consequently, each swing gets smaller than the one before it. A crucial aspect of trading this pattern is that volume typically decreases during this phase, supporting the notion that participation is decreasing.
The market isn’t preparing for a move. It’s waiting for a breakout.
The Red-Pill Insight for Traders
Although symmetrical triangles are sometimes characterized as neutral patterns, this description is not comprehensive. Although the pattern by itself might not show direction, its context is always important.
After a significant directional move, a symmetrical triangle frequently indicates a pause, which is a time when the market considers the previous action (a popular continuation pattern indicator). It may indicate that selling pressure is waning, which could result in a trend reversal, when it emerges following extended decline.
The triangle does not predict outcomes. It highlights where conviction has temporarily disappeared. Technical analysis requires waiting for the decisive move.
Why This Chart Pattern Matters?
The real value of a symmetrical triangle lies not in forecasting direction, but in understanding risk compression. As price movement narrows, uncertainty reduces. When uncertainty reduces, the market becomes sensitive to new information.
This is why symmetrical triangles often resolve around external triggers rather than internal momentum. The move past the trendlines (the breakout or breakdown) is typically fast and accompanied by a surge in volume, which provides breakout confirmation.
Conclusion
A symmetrical triangle is the market holding its breath not because it knows what comes next, but because it doesn’t. Understanding this chart pattern is less about drawing perfect trendlines and more about recognizing moments when the market has stopped arguing and started waiting. Mastering this technical analysis tool is vital for any serious trader.
For practice, check out these 3 stocks and find out if the same pattern exists in them: