There are no items in your cart
Add More
Add More
| Item Details | Price | ||
|---|---|---|---|


Among the many chart patterns used in technical analysis, breakouts often provide some of the most actionable trading opportunities. One particularly powerful setup is the Descending Parallel Channel Breakout on the Upside. While the channel itself reflects a period of controlled selling pressure, the breakout signals a shift in momentum where buyers regain control, often leading to strong upward moves.
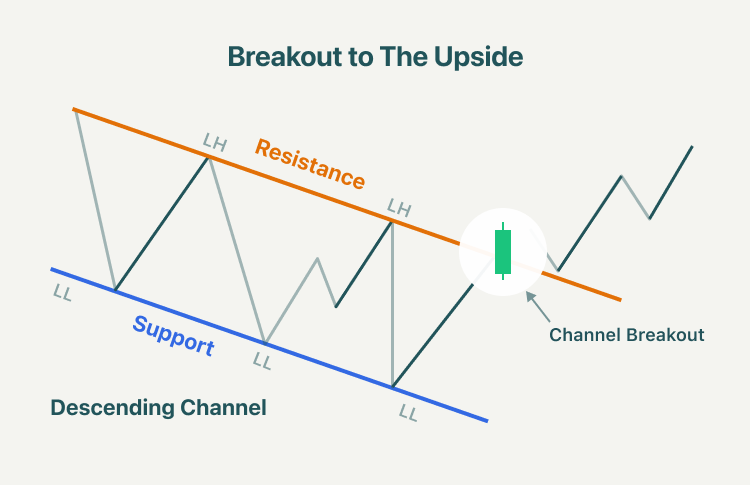
A descending parallel channel forms when the price moves within two downward-sloping, parallel trendlines. While it may look bearish at first glance, a breakout above the channel often signals the end of the downtrend and the beginning of a potential bullish rally.
What is a Descending Parallel Channel?
Structure: The price oscillates between two parallel, downward-sloping lines. The upper line acts as dynamic resistance, while the lower line acts as dynamic support.
Psychology: Sellers push the price lower within the channel, but each successive low lacks strong follow-through. When buyers finally overpower sellers, the price breaks above the upper boundary of the channel.
Breakout: A breakout occurs when the price closes convincingly above the upper channel line, showing a shift in sentiment from bearish to bullish.
How to Trade a Descending Parallel Channel Breakout
Entry Point
After breaking above the channel, the price often retests the breakout level (the upper trendline). This retest is a strong validation of the breakout.
How to use the retest in your strategy:
· Wait for the price to pull back to the broken channel resistance (now acting as support).
· Look for bullish reversal patterns such as a hammer, bullish engulfing, or strong rejection wicks.
· Enter the trade if the support holds and the price resumes upward momentum.
This retest entry provides a more favourable risk-to-reward ratio and helps avoid false breakouts.
Target Price: There are several ways to set profit targets after a breakout:

Homework: Check the following two stocks and select the one that fits the horizontal resistance breakout pattern.
1. UNO Minda Ltd. (UNOMINDA)
2. Adani Total Gas Ltd. (ATGL)
You may also add the stock to your watch list to understand further price action.
Disclaimer: This analysis is purely for educational purpose and does not contain any recommendation. Please consult your financial advisor before taking any financial decision.