There are no items in your cart
Add More
Add More
| Item Details | Price | ||
|---|---|---|---|

There was heavy sell off by FIIs in last two days, usually the sell off by FIIs is taken negatively by market.
If we were to go to the technical analysis, we can a Dark Cloud covered formed at the top of the trend in Nifty 50, this pattern is seen as bearish reversal candlestick pattern.
The other reason what we can say here is the mirroring global cues. Even when our Indian Economy stands strong & we have seen encouraging macro-economic data, we still can see the fall in Indian market on account of the ongoing rising yield, rising dollar index, and fear of further hawkish rate hikes by Fed.
And one more key point that we want to draw your attention to is the famous Buffett Indicator which helps us to know if the market is overvalued now!
The Market Cap to GDP Ratio (also known as the Buffett Indicator) is a measure of the total value of all publicly-traded stocks in a country, divided by that country’s Gross Domestic Product (GDP).
It used as a broad way of assessing whether the country’s stock market is overvalued or undervalued, compared to a historical average.

It is a form of Price/Sales valuation multiple for an entire country.
Market cap to GDP ratio of greater than 100% is generally considered a sign of being highly valued, while the same ratio trading in the range of or below 50% are considered to be cheap. In order to properly assess a market’s valuation, other factors have to be taken into consideration, such as earnings and growth.
Historical data suggests the below as far as US markets and our markets are concerned:
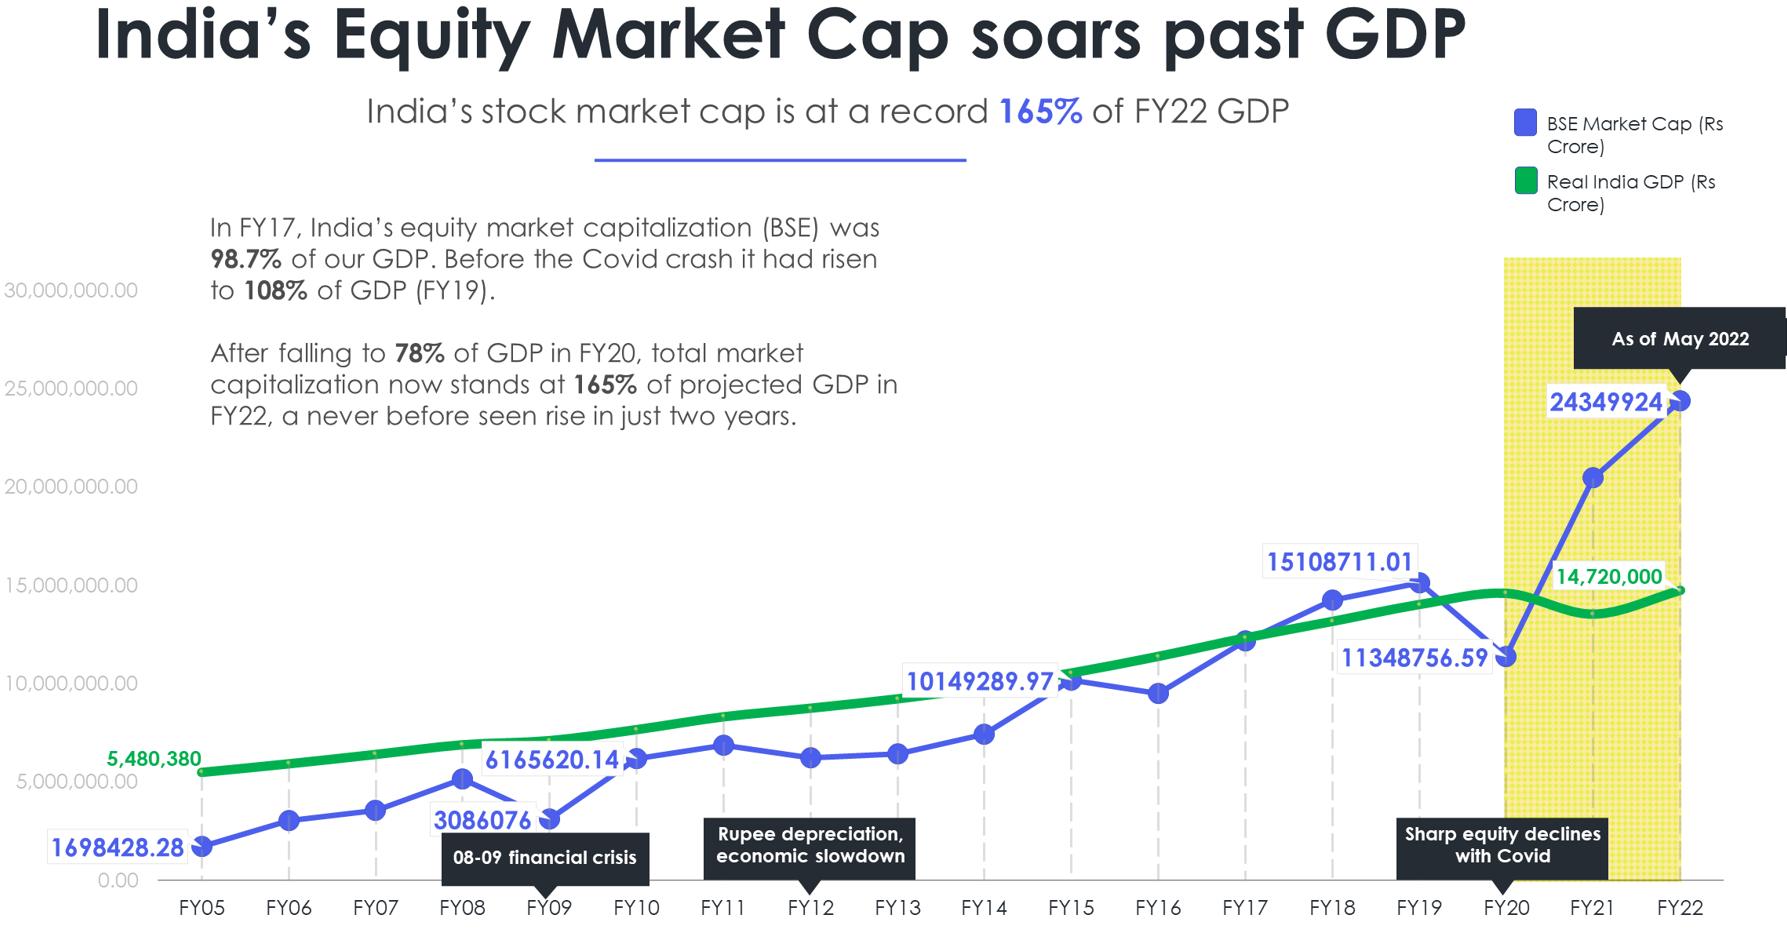
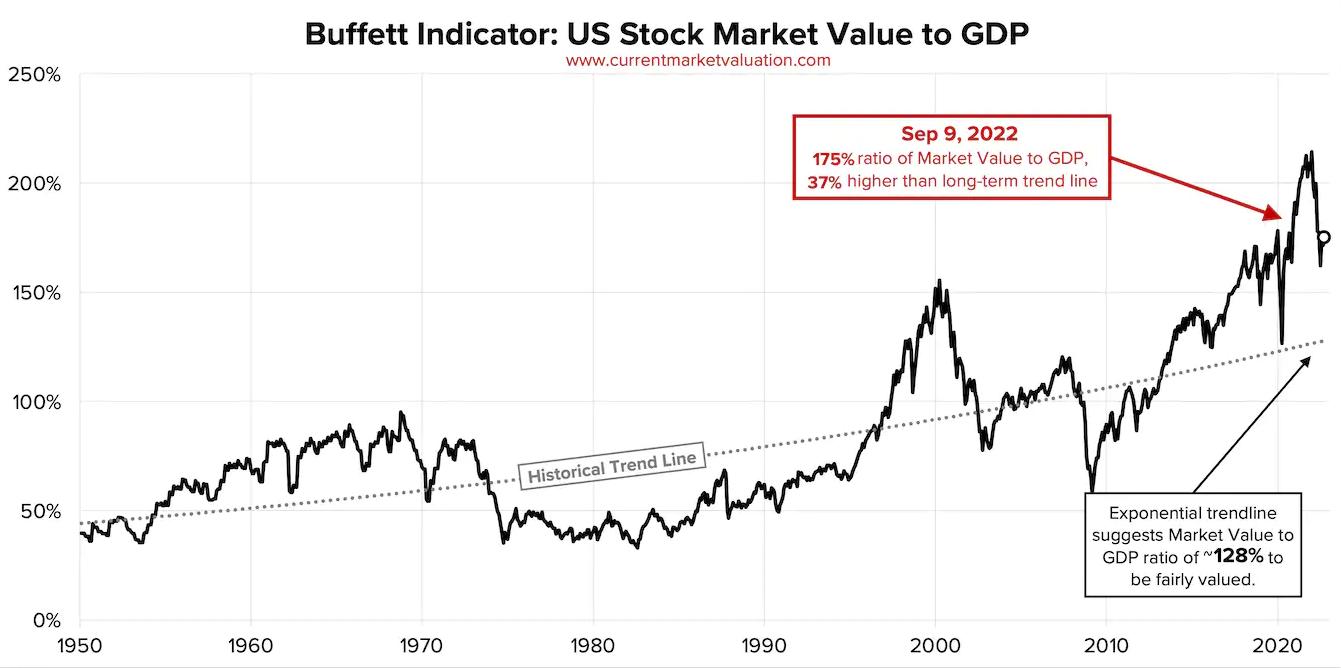
Above clearly indicates that BSE market cap of 165% as on May 2022 and US markets ratio of 175% as on September 2022 does warrant some attention of investors.
For US markets, during the covid fall of 2020, markets had taken a support at 56% of Market cap to GDP ratio.